LogStash - You don't need to deploy it to use it
This article is the first out of two. It’s based on based on the LogStash Getting Started Guide. You should probably read that instead, if you don’t yet know what LogStash is. It’s a more thorough introduction.
My goal with this article is rather to get you set up as fast as possible with a functioning local LogStash setup. The next post will provide a few pointers on how to get started parsing logs with LogStash.
Install LogStash and ElasticSearch
Always make sure you install the exact version of ElasticSearch recommended for for the version of LogStash you’re installing. This is because LogStash connects to ElasticSearch as an ES node, with a direct Java interface. I usually find the correct ElasticSearch version to use on the getting started page.
Install ElasticSearch first, then start it:
1 2 3 4 5 6 7 | |
In another terminal, install LogStash:
1 2 3 4 5 | |
Make sure you also have Netcat (nc) installed, to easily send files or stdin to a TCP port.
It may not look like it yet, but you now have everything you need to dive into your logs!
Kick the tires
ElasticSearch is already running. You can take a peek at the status of your ElasticSearch “cluster”, with the Marvel plugin: localhost:9200/_plugin/marvel.
You can poke around a bit, but you’ll soon notice that there’s not much there yet, except for one small “marvel…” index, to store the Marvel UI configs.
Let’s start LogStash with as little fuss as possible:
1 2 3 4 | |
By which we mean: listen on TCP 5555 and output to a local ElasticSearch.
Let’s try sending it something. Anything.
echo something | nc localhost 5555 echo anything | nc localhost 5555
Note: netcat has the annoying habit of not terminating when it reaches EOF on OSX. Ctrl-C.
We can see activity in the ElasticSearch terminal. Something happened.
Excellent! If you go back to Marvel, you’ll see that there’s now a
logstash.YYYY-MM-dd index. This is where today’s logs will be stored.
To actually visualize the data, you’ll need to start one last terminal, to run the Kibana web interface:
1 2 | |
Then open Kibana: localhost:9292. You can either read or ignore the Kibana welcome screen. Towards the bottom right, click the “LogStash Dashboard” link.
We now see a histogram with one bar, showing the moment when you sent dummy events. If you scroll down, you’ll see the details of the event. Click on them to expand the events, and start poking around.
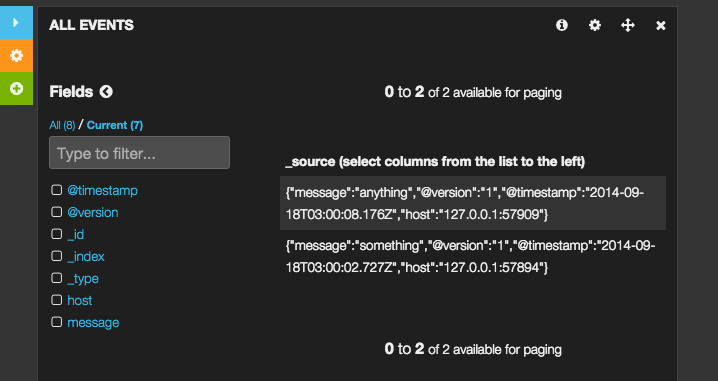
So you have a functional local LogStash setup!
I’ll cover the process of parsing logs in a follow-up post. Until then, if you want to continue playing with LogStash, you may want to clean the bogus data you just put in.
For that you’ll want to use the ElasticSearch REST API:
1
| |
Happy exploration!